 PDF(15597 KB)

全球温升1.5 ℃和2.0 ℃情景下中国降雨诱发地质灾害危险性和人口暴露度评估研究
林齐根, 王磊斌, 张家慧
地球信息科学学报 ›› 2023, Vol. 25 ›› Issue (1) : 177-189.
PDF(15597 KB)
PDF(15597 KB)
全球温升1.5 ℃和2.0 ℃情景下中国降雨诱发地质灾害危险性和人口暴露度评估研究
 ({{custom_author.role_cn}}), {{javascript:window.custom_author_cn_index++;}}
Assessment of the Rainfall-Induced Landslide Hazard and Population Exposure in China under 1.5 ℃ and 2.0 ℃ Global Warming Scenarios
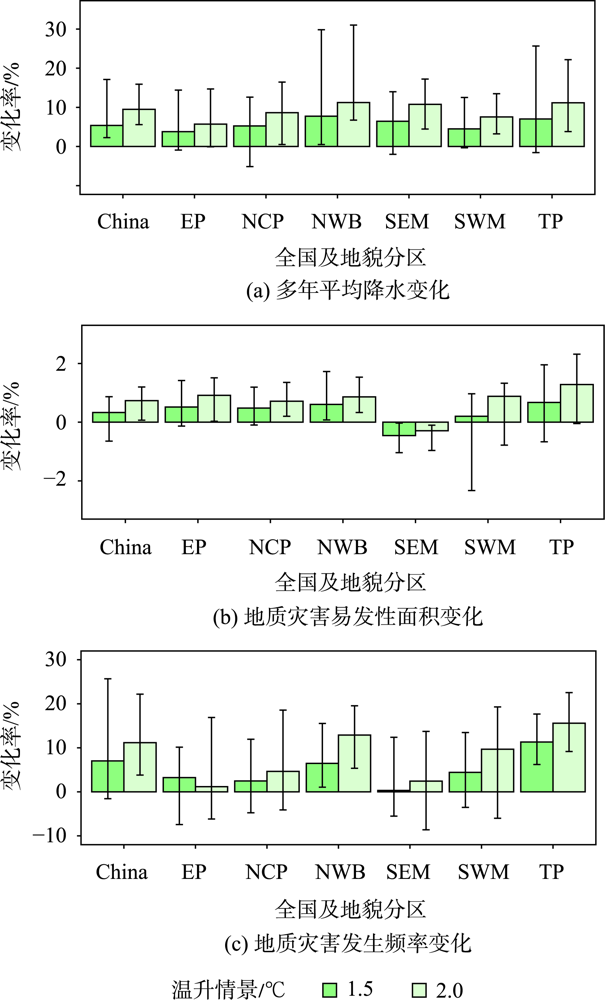
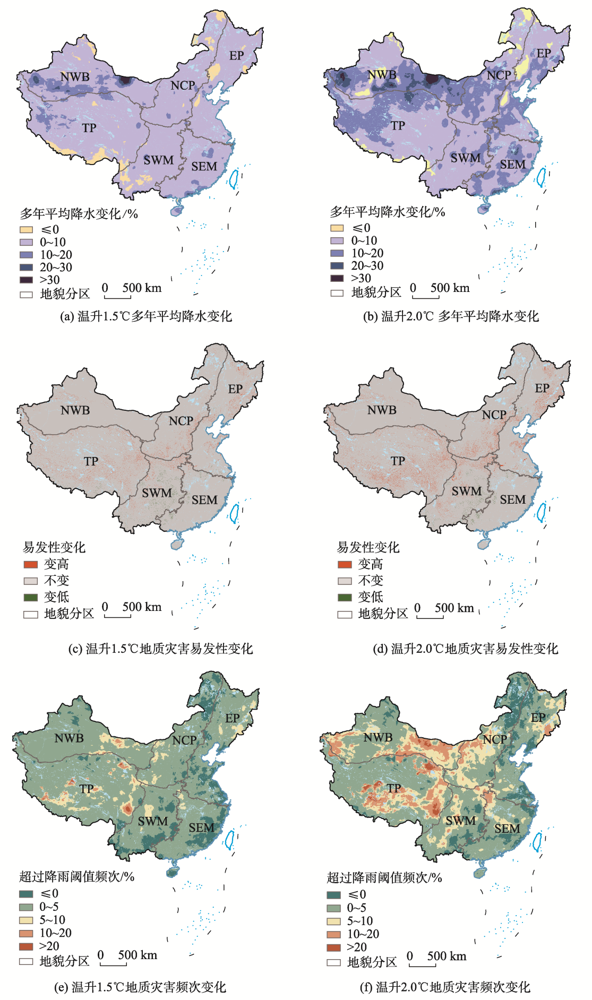
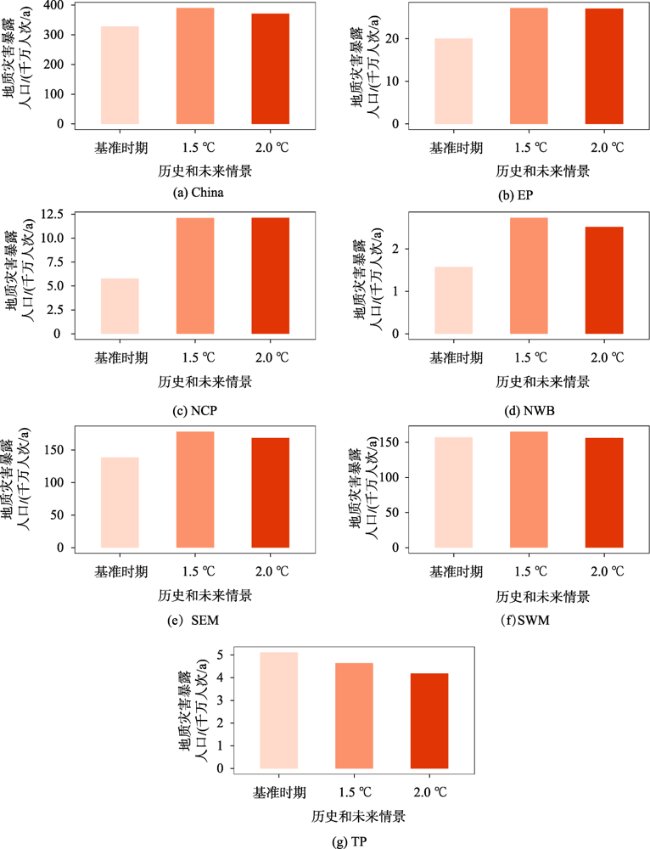
({{custom_author.role_en}}), {{javascript:window.custom_author_en_index++;}}气候变化情景下极端降水事件的频次和强度预估呈增加趋势,这会导致全球部分地区极端降雨诱发地质灾害风险的增加。本文基于中国降雨诱发地质灾害易发性模型和不同地貌分区的累积事件降雨量-降雨历时阈值曲线,采用最新的CMIP6全球气候模式多模式集合结果,基于全球温升目标情景的视角,从地质灾害空间易发性和发生频次两方面,探讨温升情景下中国地质灾害危险性的可能变化及其对暴露人口的潜在影响。结果表明,CMIP6多模式集合预估的多年平均降水在温升1.5 ℃和2.0 ℃情景下相比基准时期可能增加5.4%~9.5%,导致中等至极高地质灾害易发区范围预估增加0.33%~0.74%,由于预估的极端降水事件增加,地质灾害发生频次预估增加7.0%~11.2%,进一步综合未来人口空间分布,潜在地质灾害暴露人口可能增加6.20亿人次(18.90%)和4.26亿人次(12.97%)。各地貌分区未来情景下地质灾害危险性预估增加且存在显著的空间异质性,温升2.0 ℃情景下中等至极高易发性范围相比基准时期增加0.71%~1.28%,地质灾害发生频次预估增加1.2%~15.6%,其中,青藏高原区地质灾害危险性增加最明显。综合考虑未来人口的变化,结果显示,由于未来预估人口的明显减少,青藏高原区温升1.5 ℃和2.0 ℃时潜在的地质灾害暴露人口预估减少468万人次~928万人次,而东南丘陵区潜在的地质灾害暴露人口分别增加3.96亿人次和3.00亿人次。本研究的结果可以为制定更有针对性的适应气候变化影响和减轻地质灾害风险措施提供科学指导。
The frequency and intensity of extreme precipitation events are projected to increase under climate change scenarios, which may result in increasing risk of rainfall-induced landslide in some parts of the world. Based on the established national scale rainfall-induced landslide susceptibility model and cumulative rainfall -rainfall duration threshold curves for different geomorphic regions, this study employs the latest CMIP6 global climate model ensemble to assess the changes in landslide hazard in China under global warming in terms of both the spatial landslide susceptibility and frequency resulted from rainfall events exceeding the threshold of landslide occurrence. The results show that the multi-year mean annual precipitation projected by the CMIP6 multi-model ensemble is likely to increase by 5.4% to 9.5% under the 1.5°C and 2.0°C warming scenarios compared to the baseline period, resulting in a projected increase of 0.33% to 0.74% in moderate to very high landslide susceptibility areas, and a projected increase of 7.0% to 11.2% in landslide frequency due to the projected increase in extreme precipitation events. By further combing the projections of future population distribution, the potential exposed population is expected to increase by 620 million (18.90%) and 426 million (12.97%) under the 1.5°C and 2.0°C warming scenarios, respectively. The projected landslide hazards under the future scenarios increase in each geomorphic region, and there exists significant spatial heterogeneity. The range of moderate to very high susceptibility under a 2.0°C temperature rise scenario increases by 0.71%~1.28% compared with the baseline period, and the landslide occurrence frequency is projected to increase by 1.2%~15.6%. The CMIP6 multi-model ensemble projections reveal hotspot areas where landslide susceptibility level and frequency are expected to increase under warming scenarios, including the southeastern Tibetan Plateau, the Tianshan Mountains in the northwest, and the Kunlun Mountains at the border of the Tibetan Plateau. And Qilian Mountains in the southwest mountainous region, the Loess Plateau and the Taihang Mountains in the south of the north-central plain region, and the Changbai area in the eastern plain region, are also key areas where appropriate landslide risk mitigation measures for climate change adaptation are needed. Considering the future population changes, our results show that the potential landslide exposed population in the Qinghai-Tibet Plateau area is expected to decrease by 4.68 million to 9.28 million, respectively, due to the obvious decrease in predicted future population, while the potential landslide exposed population in the southeastern hilly area increases by 396 million and 300 million, respectively, when temperature rises by 1.5°C and 2.0°C.
降雨诱发地质灾害 / 危险性 / 气候变化 / CMIP6 / 人口暴露度 / 温升情景 / 多模式集合 / 预估 {{custom_keyword}} /
rainfall-induced landslides / hazard / climate change / CMIP6 / population exposure / global warming scenarios / multi-model ensemble / projection {{custom_keyword}} /
表1 主要数据来源Tab. 1 List of the main data source of this study |
| 数据类别 | 数据名称 | 数据来源 | 数据内容 |
|---|---|---|---|
| 观测降水数据 | CN05.1格点化观测数据集 | 吴佳和高学杰[28] | 1961—2018年逐日降水 |
| 气候模式历史模拟和未来预估数据 | CMIP6全球气候模式数据 | https://esgf-node.llnl.gov/projects/cmip6/ | 历史时期(1850—2014年)和未来情景(2015—2100年)的逐日降水 |
| 地质灾害空间易发性评估影响因素 | 中国地质灾害空间易发性评估影响因素数据集 | Lin等[31] | 岩性、坡度、降水、土壤湿度、土地利用、地质环境分区等因素 |
| 历史人口空间分布数据 | Gridded Population of the World (GPW), v4 | https://sedac.ciesin.columbia.edu/data/collection/gpw-v4 | 2015年全球1 km人口空间分布数据 |
| 未来人口空间分布数据 | Global 1-km Downscaled Population Projection Grids Based on the SSPs, v1.01 | https://sedac.ciesin.columbia.edu/data/set/popdynamics-1-km-downscaled-pop-base-year-projection-ssp-2000-2100-rev01 | 共享社会经济路径(SSP1—SSP5) 2010—2100年1 km预估人口空间分布数据 |
表2 本文采用的24个CMIP6全球气候模式Tab. 2 List of the 24 CMIP6 global climate models used in this study |
| 编号 | 名称 |
|---|---|
| 1 | ACCESS-CM2 |
| 2 | ACCESS-ESM1-5 |
| 3 | BCC-CSM2-MR |
| 4 | CanESM5 |
| 5 | CESM2-WACCM |
| 6 | CMCC-CM2-SR5 |
| 7 | CMCC-ESM2 |
| 8 | EC-Earth3 |
| 9 | EC-Earth3-Veg |
| 10 | EC-Earth3-Veg-LR |
| 11 | FGOALS-g3 |
| 12 | GFDL-ESM4 |
| 13 | IITM-ESM |
| 14 | INM-CM4-8 |
| 15 | INM-CM5-0 |
| 16 | IPSL-CM6A-LR |
| 17 | KACE-1-0-G |
| 18 | MIROC6 |
| 19 | MPI-ESM1-2-HR |
| 20 | MPI-ESM1-2-LR |
| 21 | MRI-ESM2-0 |
| 22 | NorESM2-LM |
| 23 | NorESM2-MM |
| 24 | TaiESM1 |
表3 不同情景下全球温升1.5 ℃和2.0 ℃对应的时期Tab. 3 Periods corresponding to global temperature rise of 1.5 °C and 2.0 °C under different scenarios |
| 情景 | 1.5 ℃ | 2.0 ℃ |
|---|---|---|
| SSP1-2.6 | 2023—2042年 | — |
| SSP2-4.5 | 2021—2040年 | 2043—2062年 |
| SSP5-8.5 | 2018—2037年 | 2032—2051年 |
| [1] |
{{custom_citation.content}}
{{custom_citation.annotation}}
|
| [2] |
国家统计局. 中国统计年鉴—2021(总第40期)[M]. 北京: 中国统计出版社, 2021.
[National Bureau of Statistics of China. China statistical yearbook 2021[M]. Beijing: China Statistics Press, 2021. ]
{{custom_citation.content}}
{{custom_citation.annotation}}
|
| [3] |
Intergovernmental Panel on Climate Change (IPCC). Climate Change 2021 - The Physical Science Basis: Working Group I Contribution to the Sixth Assessment Report of the Intergovernmental Panel on Climate Change[M]. Cambridge, United Kingdom and New York, NY, USA: Cambridge University Press, 2021. DOI:10.1017/9781009157896
{{custom_citation.content}}
{{custom_citation.annotation}}
|
| [4] |
{{custom_citation.content}}
{{custom_citation.annotation}}
|
| [5] |
{{custom_citation.content}}
{{custom_citation.annotation}}
|
| [6] |
{{custom_citation.content}}
{{custom_citation.annotation}}
|
| [7] |
{{custom_citation.content}}
{{custom_citation.annotation}}
|
| [8] |
{{custom_citation.content}}
{{custom_citation.annotation}}
|
| [9] |
{{custom_citation.content}}
{{custom_citation.annotation}}
|
| [10] |
{{custom_citation.content}}
{{custom_citation.annotation}}
|
| [11] |
{{custom_citation.content}}
{{custom_citation.annotation}}
|
| [12] |
{{custom_citation.content}}
{{custom_citation.annotation}}
|
| [13] |
{{custom_citation.content}}
{{custom_citation.annotation}}
|
| [14] |
{{custom_citation.content}}
{{custom_citation.annotation}}
|
| [15] |
{{custom_citation.content}}
{{custom_citation.annotation}}
|
| [16] |
{{custom_citation.content}}
{{custom_citation.annotation}}
|
| [17] |
{{custom_citation.content}}
{{custom_citation.annotation}}
|
| [18] |
{{custom_citation.content}}
{{custom_citation.annotation}}
|
| [19] |
{{custom_citation.content}}
{{custom_citation.annotation}}
|
| [20] |
麦鉴锋, 冼宇阳, 刘桂林. 气候变化情景下广东省降雨诱发型滑坡灾害潜在分布及预测[J]. 地球信息科学学报, 2021, 23(11):2042-2054.
降雨诱发型滑坡灾害导致了人居环境的破坏并带来巨大的经济损失,尤其是在经济高度发达的粤港澳大湾区城市群。因此,急需有关降雨诱发型滑坡灾害分布的影响因素以及未来气候变化情景下潜在分布的研究。本文从气候变化角度出发,基于最大熵(MaxEnt)模型,结合气候、地形、地表覆盖等数据,揭示不同影响因素对当前气候环境下广东省滑坡空间分布的作用,进而阐述了未来气候情景下滑坡的潜在分布。结果表明:① 影响滑坡灾害空间分布的主要因子为最湿季度降雨量、7月降雨量、海拔和4月降雨量;② 当最湿季度降雨量处于593~742 mm、7月降雨量处于139~223 mm、海拔处于81~397 m和4月降雨量处于154~186 mm之间时,滑坡灾害较易发生;③ 受到气候变化的影响,当前密集分布于粤东地区的滑坡灾害高风险区的潜在分布范围和危害性总体呈现扩大趋势。本研究的结果可以为国土空间规划及城市群灾害预防提供科学依据。
[
{{custom_citation.content}}
{{custom_citation.annotation}}
|
| [21] |
王霞, 王瑛, 林齐根, 等. 气候变化背景下中国滑坡灾害人口风险评估[J]. 气候变化研究进展, 2022, 18(2):166-176.
[
{{custom_citation.content}}
{{custom_citation.annotation}}
|
| [22] |
{{custom_citation.content}}
{{custom_citation.annotation}}
|
| [23] |
{{custom_citation.content}}
{{custom_citation.annotation}}
|
| [24] |
{{custom_citation.content}}
{{custom_citation.annotation}}
|
| [25] |
{{custom_citation.content}}
{{custom_citation.annotation}}
|
| [26] |
{{custom_citation.content}}
{{custom_citation.annotation}}
|
| [27] |
{{custom_citation.content}}
{{custom_citation.annotation}}
|
| [28] |
吴佳, 高学杰. 一套格点化的中国区域逐日观测资料及与其它资料的对比[J]. 地球物理学报, 2013, 56(4):1102-1111.
[
{{custom_citation.content}}
{{custom_citation.annotation}}
|
| [29] |
{{custom_citation.content}}
{{custom_citation.annotation}}
|
| [30] |
{{custom_citation.content}}
{{custom_citation.annotation}}
|
| [31] |
{{custom_citation.content}}
{{custom_citation.annotation}}
|
| [32] |
{{custom_citation.content}}
{{custom_citation.annotation}}
|
| [33] |
Globally, flood risk is projected to increase in the future due to climate change and population growth. Here, we quantify the role of dams in flood mitigation, previously unaccounted for in global flood studies, by simulating the floodplain dynamics and flow regulation by dams. We show that, ignoring flow regulation by dams, the average number of people exposed to flooding below dams amount to 9.1 and 15.3 million per year, by the end of the 21 century (holding population constant), for the representative concentration pathway (RCP) 2.6 and 6.0, respectively. Accounting for dams reduces the number of people exposed to floods by 20.6 and 12.9% (for RCP2.6 and RCP6.0, respectively). While environmental problems caused by dams warrant further investigations, our results indicate that consideration of dams significantly affect the estimation of future population exposure to flood, emphasizing the need to integrate them in model-based impact analysis of climate change.
{{custom_citation.content}}
{{custom_citation.annotation}}
|
| [34] |
{{custom_citation.content}}
{{custom_citation.annotation}}
|
| [35] |
{{custom_citation.content}}
{{custom_citation.annotation}}
|
| [36] |
{{custom_citation.content}}
{{custom_citation.annotation}}
|
| [37] |
Climate changes significantly impact environmental and hydrological processes. Precipitation is one of the most significant climatic parameters and its variability and trends have great influences on environmental and socioeconomic development. We investigate the spatio-temporal variability of precipitation occurrence frequency, mean precipitation depth, PVI and total precipitation in China based on long-term precipitation series from 1961 to 2015. As China's topography is diverse and precipitation is affected by topography strongly, ANUSPLIN can model the effect of topography on precipitation effectively is adopted to generate the precipitation interpolation surface. Mann-Kendall trend analysis and simple linear regression was adopted to examine long-term trend for these indicators. The results indicate ANUSPLIN precipitation surface is reliable and the precipitation variation show different regional and seasonal trend. For example, there is a sporadic with decreasing frequency precipitation trend in spring and a uniform with increasing frequency trend in summer in Yangtze Plain, which may affect spring ploughing and alteration of flood risk for this main rice-production areas of China. In north-western China, there is a uniform with increasing precipitation frequency and intensity trend, which is beneficial for this arid region. Our study could be helpful for other counties with similar climate types.
{{custom_citation.content}}
{{custom_citation.annotation}}
|
| [38] |
{{custom_citation.content}}
{{custom_citation.annotation}}
|
| [39] |
{{custom_citation.content}}
{{custom_citation.annotation}}
|
| [40] |
{{custom_citation.content}}
{{custom_citation.annotation}}
|
| {{custom_ref.label}} |
{{custom_citation.content}}
{{custom_citation.annotation}}
|


 PDF(15597 KB)
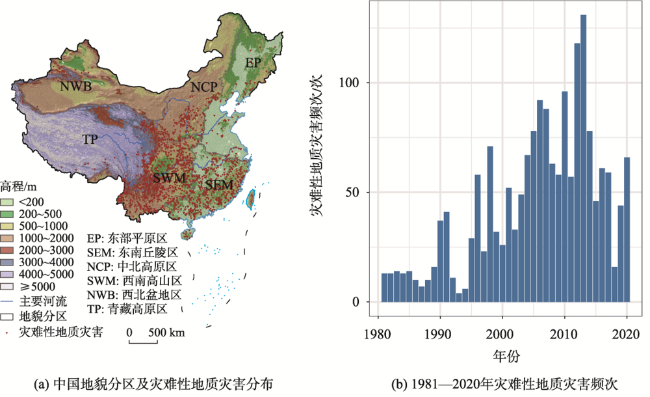
 图1 中国地貌分区和灾难性地质灾害的时空分布
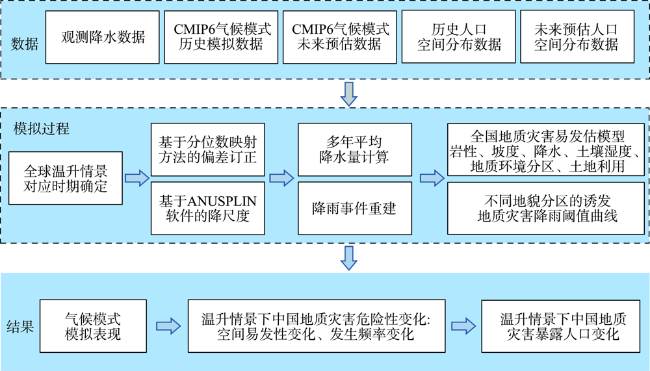
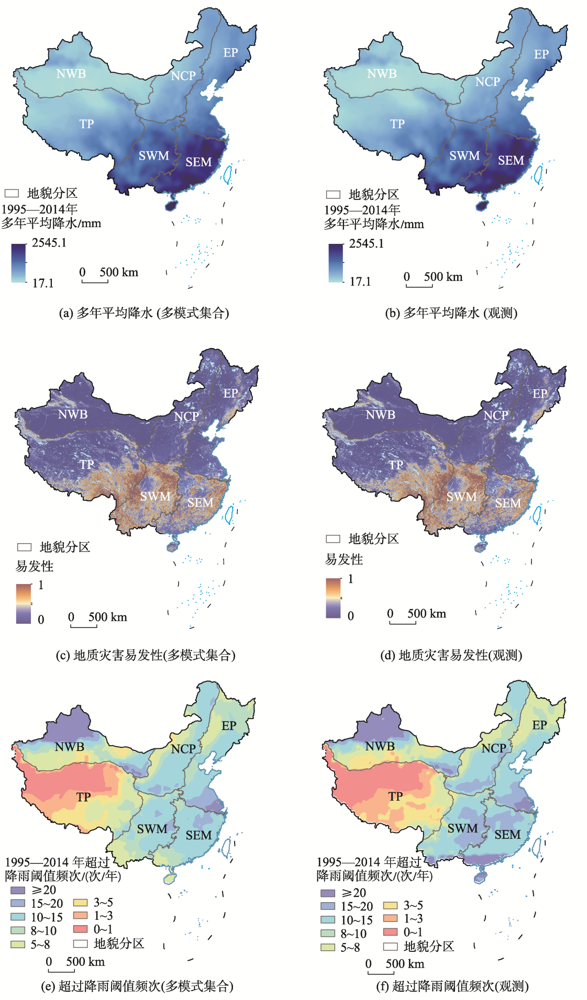
 表1 主要数据来源表2 本文采用的24个CMIP6全球气候模式图2 技术路线表3 不同情景下全球温升1.5 ℃和2.0 ℃对应的时期图3 全球气候模式在基准时期和观测数据的模拟效果对比图4 全球温升1.5 ℃和2.0 ℃情景下中国及各地貌分区多年平均降水、地质灾害危险性相比基准时期的变化图5 全球温升1.5 ℃和2.0 ℃情景下中国地质灾害危险性相比基准时期变化的空间分布图6 全球不同温升情景下中国及各地貌分区地质灾害暴露人口变化
/
| 〈 |
|
〉 |


