
Comparison of CMIP6 and CMIP5 models performance in simulating temperature in Northeast China
-
摘要:
本文基于CN05.1逐月气温观测资料和CMIP6计划中34个模式资料、CMIP5中39个模式资料,利用泰勒图、技能得分(S值)、综合评级指标(Mr),系统地评估了相比于CMIP5模式,CMIP6模式对1961—2005年中国东北地区(黑龙江省、吉林省、辽宁省)气温模拟能力.结果表明:1)相较于CMIP5模式,CMIP6中大部分模式能更好地模拟出区域平均气温多年变化、年平均气温气候态空间分布及年平均气温气候倾向率的空间分布的特征,但普遍存在低估的现象;2)经过优选后得到的CMIP5与CMIP6最优模式集合平均(MME5、MME6)对年平均气温的模拟优于大部分单个模式和所有模式的集合平均模拟结果.MME6比MME5能更好地模拟出年平均气温气候态及气温多年变化趋势的空间分布特征,但对区域平均气温多年变化的模拟能力要略低.总体来说,CMIP6模式相对于CMIP5有所进步,MME6对中国东北地区气温的时空变化特征具有一定的模拟能力.
Abstract:Based on the observational data of CN05.1, this article evaluated and compared the performance of 39 CMIP5 (Coupled Model Intercomparison Project phase 5) models and 34 CMIP6 (CMIP phase 6) models in simulating surface air temperature of the three provinces in Northeast China (the Heilongjiang, Jilin and Liaoning Province) by Taylor diagram, skill scores (S value) and the composite rating indicators (Mr). Results showed that: 1) The CMIP6 models possess a relatively higher capability in simulating the temperature from the interannual variations of regionally averaged surface air temperature, spatial distributions of annual mean surface air temperature and its trend than CMIP5 models but shows a negative bias; 2) CMIP5 and CMIP6 preferred ensemble mean (MME5 and MME6) generally performs better than the individual models. Compared with the MME5, MME6 shows a significant improvement in simulating the climatological spatial distribution of temperature and its trend, whilst is slightly inferior in simulating the interannual variations of regionally averaged temperature. Generally speaking, CMIP6 models exhibit a significant improvement compared to the CMIP5 models and MME6 has been proven effective at simulating the temperature in Northeast China.
-
Key words:
- CMIP6 /
- CMIP5 /
- Northeast China /
- Temperature /
- Model evaluation
-

-
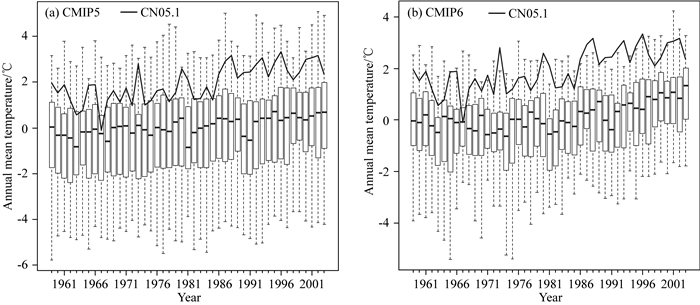
图 1
1961—2005年CMIP5 (a) 与CMIP6 (b) 模式模拟中国东北地区区域平均气温多年变化箱线图
Figure 1.
Time series of regionally averaged surface temperature over the three provinces in Northeast China for the CMIP5 (a) and CMIP6 (b) models during 1961—2005 Black solid lines indicate the observation.

图 2
1961—2005年中国东北地区CMIP5 (a)、CMIP6 (b)模式模拟的区域平均气温相对于观测的区域平均气温多年变化的泰勒图
Figure 2.
Taylor diagrams for time series of regionally averaged surface air temperature of the three provinces in Northeast China between CMIP5 (a), CMIP6 (b) models and observations for the period 1961—2005
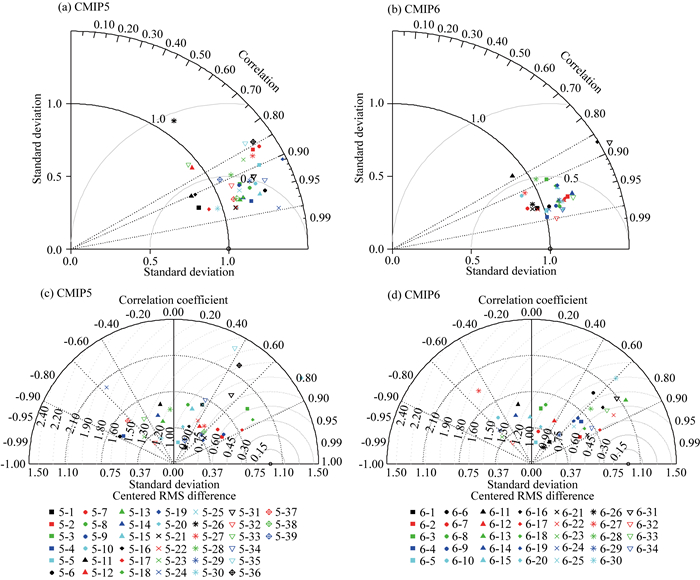

图 4
不同模式的个数对优选模式集合平均方案模拟能力的影响. (a—c) 分别为基于S值的优选模式集合平均对年平均气温气候态空间分布、区域平均气温多年变化及年平均气温气候倾向率的模拟能力. (d) 为基于Mr的优选模式集合平均的模拟能力
Figure 4.
The influence of the number of ensemble members on the models′ capability for spatial distributions of annual mean surface air temperature (a), interannual variations of regionally averaged surface air temperature (b) and spatial distributions of annual mean surface air temperature trends (c) based on the S value (a—c) and Mr (d)

图 5
1961—2005年中国东北地区CMIP5与CMIP6最优模式集合方案(MME5与MME6)模拟相对于观测在3个角度下的泰勒图(a)与其模拟中国东北地区区域平均气温多年变化的结果(b)
Figure 5.
Taylor diagrams for the three provinces in Northeast China between the preferred models ensemble mean for CMIP5 (a, MME5)/ CMIP6 (b, MME6) and observations under 3 dimensions for the period 1961—2005 (a) and interannual variations of regionally averaged surface air temperature over the three provinces in Northeast China for MME5 and MME6 during 1961—2005 (b)
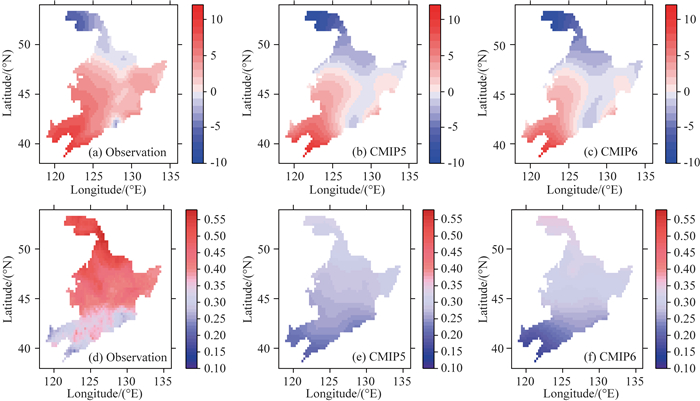
图 6
1961—2005年中国东北地区观测场(a、d)与CMIP5(b、e)、CMIP6(c、f)最优模式集合方案(MME5与MME6)的年平均气温气候态空间分布(a—c, 单位: ℃)及其气候倾向率空间分布(d—f, 单位: ℃/10a)
Figure 6.
Spatial distributions of annual mean surface air temperature (a—c, units=℃) and trends (d—f, units=℃/10a) of the three provinces in Northeast China over the period of 1961—2005 for the CN05.1 (a, d), CMIP5 (b, e) and CMIP6 (c, f) preferred models ensemble mean (MME5, MME6)
表 1
模式的基本信息
Table 1.
Brief introduction of the models
模式编号 模式名称 国家 分辨率(经向(°)×纬向(°)) 模式编号 模式名称 国家 分辨率(经向(°)×纬向(°)) 5-1 ACCESS1-0 澳大利亚 192×145 6-1 ACCESS-EMS1-5 澳大利亚 192×145 5-2 BCC-CSM1-1 中国 128×64 6-2 BCC-CSM2-MR 中国 320×160 5-3 CanESM2 加拿大 128×64 6-3 CanESM5 加拿大 128×64 5-4 CESM1-CAM5 美国 288×192 6-4 CESM2 美国 288×192 5-5 CESM1-WACCM 美国 144×96 6-5 CESM2-WACCM 美国 288×192 5-6 CMCC-CMS 意大利 192×96 6-6 CMCC-CM2-HR4 意大利 288×192 5-7 FGOALS-g2 中国 128×60 6-7 FGOALS-g3 中国 180×80 5-8 GFDL-CM3 美国 144×90 6-8 GFDL-CM4 美国 288×180 5-9 GFDL-ESM2M 美国 144×90 6-9 GFDL-ESM4 美国 288×180 5-10 GISS-E2-H 美国 144×90 6-10 GISS-E2-1-H 美国 144×90 5-11 INMCM4 俄罗斯 180×120 6-11 INM-CM5-0 俄罗斯 180×120 5-12 IPSL-CM5A-LR 法国 96×96 6-12 IPSL-CM6A-LR 法国 144×143 5-13 MIROC5 日本 256×128 6-13 MIROC6 日本 256×128 5-14 MPI-ESM-LR 德国 192×96 6-14 MPI-ESM1-2-LR 德国 192×96 5-15 MRI-CGCM3 日本 320×160 6-15 MRI-ESM2-0 日本 320×160 5-16 NorESM1-M 挪威 144×96 6-16 NorESM2-LM 挪威 144×96 5-17 ACCESS1-3 澳大利亚 192×145 6-17 BCC-ESM1 中国 128×64 5-18 BCC-CSM1-1-M 中国 320×160 6-18 CAMS-CSM1-0 中国 320×160 5-19 BNU-ESM 中国 128×64 6-19 CESM2-FV2 美国 144×96 5-20 CCSM4 美国 288×192 6-20 CESM2-WACCM-FV2 美国 144×96 5-21 CESM1-BGC 美国 288×192 6-21 CMCC-CM2-SR5 意大利 288×192 5-22 CESM1-FASTCHEM 美国 288×192 6-22 E3SM-1-0 美国 360×180 5-23 CMCC-CESM 意大利 96×48 6-23 E3SM-1-1 美国 360×180 5-24 CMCC-CM 意大利 480×240 6-24 E3SM-1-1-ECA 美国 360×180 5-25 CNRM-CM5 法国 256×128 6-25 FGOALS-f3-L 中国 288×180 5-26 CSIRO-Mk3-6-0 澳大利亚 192×96 6-26 GISS-E2-1-G 美国 144×90 5-27 FGOALS2-s 中国 128×108 6-27 INM-CM4-8 俄罗斯 180×120 5-28 GFDL-CM2p1 美国 144×90 6-28 MCM-UA-1-0 美国 96×80 5-29 GFDL-ESM2G 美国 144×90 6-29 MPI-ESM-1-2-HAM 德国 192×96 5-30 GISS-E2-R 美国 144×90 6-30 NESM3 中国 192×96 5-31 HadCM3 英国 96×73 6-31 NorCPM1 挪威 144×96 5-32 IPSL-CM5A-MR 法国 144×143 6-32 NorESM2-MM 挪威 288×192 5-33 IPSL-CM5B-LR 法国 96×96 6-33 SAM0-UNICON 韩国 288×192 5-34 MIROC4h 日本 640×320 6-34 TaiESM1 中国,台湾 288×192 5-35 MIROC-ESM 日本 128×64 5-36 MIROC-ESM-CHEM 日本 128×64 5-37 MPI-ESM-MR 德国 192×96 5-38 MPI-ESM-P 德国 192×96 5-39 NorESM1-ME 挪威 144×96  下载: 导出CSV
表 2
1961—2005年CMIP5、CMIP6模式模拟的中国东北地区年平均气温线性趋势
Table 2.
Linear trends of annual mean surface air temperature over the three provinces in Northeast China for the CMIP5 and CMIP6 models during 1961—2005
模式编号 线性趋势(℃·10a-1) 模式编号 线性趋势(℃·10a-1) 模式编号 线性趋势(℃·10a-1) 模式编号 线性趋势(℃·10a-1) 5-1 0.23* 5-22 0.20* 6-1 0.36*** 6-22 0.24*** 5-2 0.28*** 5-23 0.02 6-2 0.14 6-23 0.49** 5-3 0.42*** 5-24 0.36*** 6-3 0.44*** 6-24 0.31*** 5-4 0.09 5-25 0.22* 6-4 0.31*** 6-25 0.37*** 5-5 0.11 5-26 0.19** 6-5 0.33** 6-26 0.23*** 5-6 0.28*** 5-27 0.65*** 6-6 0.38*** 6-27 -0.04 5-7 0.24** 5-28 0.25** 6-7 0.15 6-28 0.38** 5-8 0.11 5-29 0.33*** 6-8 0.30*** 6-29 0.15 5-9 0.27** 5-30 0.14* 6-9 -0.01 6-30 0.30** 5-10 0.05 5-31 0.18* 6-10 0.31** 6-31 0.17 5-11 0.08 5-32 0.23*** 6-11 -0.05*** 6-32 0.42*** 5-12 0.38*** 5-33 0.08 6-12 0.14 6-33 0.34*** 5-13 0.14* 5-34 0.21*** 6-13 0.22 6-34 0.36*** 5-14 0.22** 5-35 0.06 6-14 0.32* MME6 0.31*** 5-15 0.14* 5-36 0.26** 6-15 0.19*** 5-16 0.30*** 5-37 0.20** 6-16 0.25* 5-17 0.19** 5-38 0.27*** 6-17 0.32** 5-18 0.26* 5-39 0.07 6-18 0.09*** 5-19 0.60*** MME5 0.34*** 6-19 0.35 5-20 0.26** CN05.1 0.42*** 6-20 0.27*** 5-21 0.33*** 6-21 0.38** 注: ***表示通过99.9%的信度水平检验, **表示通过99%的信度水平检验, *表示通过95%的信度水平检验.MME5与MME6分别为CMIP5与CMIP6经过筛选后的最优模式集合平均, CN05.1为观测值.
下载: 导出CSV
表 3
CMIP5模式、CMIP6模式对区域平均多年变化、年平均气温空间分布和年平均气温气候倾向率空间分布的S值与Mr
Table 3.
The interannual variations of regionally averaged surface air temperature, the spatial distributions of annual mean air surface temperature and the trends for the CMIP5 and CMIP6 models by a comprehensive metric proposed by Taylor and composite rating indicator
CMIP5和CMIP6共有模式 CMIP5或CMIP6模式 模式编号 区域平均气温多年变化(S值/排名) 年平均气温气候态空间分布(S值/排名) 年平均气温气候倾向率空间分布(S值/排名) 综合排名指标(Mr/排名) 模式编号 区域平均气温多年变化(S值/排名) 年平均气温气候态空间分布(S值/排名) 年平均气温气候倾向率空间分布(S值/排名) 综合排名指标(Mr/排名) 6-1 0.868/3 0.951/12 0.167/27 0.588/13 6-17 0.500/22 0.680/33 0.793/9 0.373/24 5-1 0.604/13 0.912/13 0.285/18 0.624/8 6-18 0.352/27 0.929/20 0.269/24 0.304/28 6-2 0.302/30 0.921/22 0.444/21 0.284/31 6-19 0.779/5 0.876/26 0.746/20 0.598/10 5-2 0.723/10 0.718/33 0.712/5 0.590/11 6-20 0.470/23 0.875/27 0.530/19 0.324/27 6-3 0.818/4 0.838/30 0.109/29 0.382/23 6-21 0.556/17 0.968/6 0.334/22 0.559/15 5-3 0.877/2 0.873/20 0.811/3 0.786/2 6-22 0.600/13 0.947/14 0.836/6 0.676/5 6-4 0.308/29 0.991/2 0.652/13 0.569/14 6-23 0.516/21 0.957/11 0.941/1 0.676/5 5-4 0.450/24 0.937/8 0.000/38 0.402/28 6-24 0.551/18 0.950/13 0.444/20 0.500/19 6-5 0.635/10 0.970/4 0.333/23 0.637/9 6-25 0.958/2 0.969/5 0.000/34 0.598/10 5-5 0.340/30 0.788/29 0.030/28 0.256/33 6-26 0.598/14 0.974/3 0.563/18 0.657/8 6-6 0.995/1 0.957/10 0.586/16 0.735/3 6-27 0.065/34 0.858/28 0.002/32 0.078/33 5-6 0.495/21 0.886/17 0.000/39 0.342/31 6-28 0.341/28 0.820/31 0.686/12 0.304/28 6-7 0.547/19 0.930/19 0.062/30 0.333/26 6-29 0.227/31 0.937/18 0.718/11 0.412/22 5-7 0.470/22 0.705/34 0.589/7 0.462/23 6-30 0.618/11 0.941/15 0.628/15 0.598/10 6-8 0.612/12 0.958/8 0.645/14 0.667/7 6-31 0.402/25 0.675/34 0.803/8 0.343/25 5-8 0.337/31 0.889/16 0.143/22 0.410/27 6-32 0.535/20 0.996/1 0.176/26 0.539/16 6-9 0.191/32 0.957/9 0.573/17 0.431/21 6-33 0.443/24 0.920/23 0.850/4 0.500/19 5-9 0.862/4 0.877/18 0.713/4 0.778/3 6-34 0.694/8 0.968/7 0.848/5 0.804/1 6-10 0.677/9 0.928/21 0.862/2 0.686/4 5-17 0.394/25 0.947/5 0.947/2 0.726/5 5-10 0.227/36 0.867/21 0.700/6 0.462/23 5-18 0.537/17 0.930/11 0.948/1 0.752/4 6-11 0.123/33 0.858/29 0.002/33 0.069/34 5-19 0.651/11 0.748/31 0.358/11 0.547/16 5-11 0.297/34 0.832/27 0.023/29 0.231/36 5-20 0.514/20 0.968/1 0.085/24 0.615/9 6-12 0.396/26 0.730/32 0.128/28 0.157/32 5-21 0.756/8 0.968/2 0.385/10 0.829/1 5-12 0.747/9 0.697/35 0.275/19 0.462/23 5-22 0.391/26 0.967/3 0.248/20 0.581/12 6-13 0.768/7 0.937/17 0.238/25 0.520/18 5-23 0.374/28 0.763/30 0.000/37 0.188/38 5-13 0.593/14 0.940/6 0.014/30 0.231/13 5-24 0.919/1 0.917/12 0.001/34 0.598/10 6-14 0.776/6 0.940/16 0.856/3 0.755/2 5-25 0.389/27 0.902/15 0.287/17 0.496/21 5-14 0.242/35 0.931/10 0.012/31 0.462/29 5-26 0.607/12 0.418/39 0.080/25 0.350/29 6-15 0.565/16 0.906/24 0.813/7 0.539/16 5-27 0.788/5 0.747/32 0.352/13 0.573/13 5-15 0.464/23 0.905/14 0.181/21 0.573/20 5-28 0.297/33 0.827/28 0.044/27 0.248/35 6-16 0.569/15 0.885/25 0.043/31 0.304/28 5-29 0.521/19 0.860/22 0.317/15 0.521/18 5-16 0.780/6 0.841/24 0.141/23 0.350/16 5-30 0.366/29 0.959/4 0.002/33 0.436/26 5-31 0.529/18 0.839/25 0.557/8 0.564/15 5-32 0.772/7 0.876/19 0.000/36 0.470/22 5-33 0.130/39 0.666/38 0.002/32 0.068/39 5-34 0.862/3 0.845/23 0.305/16 0.641/7 5-35 0.190/37 0.686/36 0.326/14 0.256/33 5-36 0.319/32 0.684/37 0.433/9 0.333/32 5-37 0.560/15 0.937/7 0.000/35 0.513/19 5-38 0.538/16 0.934/9 0.356/12 0.684/6 5-39 0.170/38 0.835/26 0.080/26 0.231/36 注: 表中, 前16行内上方为CMIP6模式, 下方为CMIP5模式.加粗表示与CMIP5相比, 该模式的模拟能力上升.
下载: 导出CSV
-
Ao X, Zhao C Y, Cui Y, et al. 2021. Evaluation and projection of temperature change in Northeast China. Journal of Meteorology and Environment (in Chinese), 37(1): 33-42, doi:10.3969/j.issn.1673-503X.2021.01.005.
Chen H P, Sun J Q. 2009. How the "Best" models project the future precipitation change in China. Advances in Atmospheric Sciences, 26(4): 773-782, doi:10.1007/s00376-009-8211-7.
Chen H P. 2013. Projected change in extreme rainfall events in China by the end of the 21st century using CMIP5 models. Chinese Science Bulletin, 58(12): 1462-1472, doi:10.1007/s11434-012-5612-2.
Chen H P, Sun J Q, Lin W Q, et al. 2020. Comparison of CMIP6 and CMIP5 models in simulating climate extremes. Science Bulletin, 65(17): 1415-1418, doi:10.1016/j.scib.2020.05.015.
Cui Y, Li Q, Zhou X Y, et al. 2013. Simulation and projection of the surface temperature based on five global climate models over the northeast China. Journal of Meteorology and Environment (in Chinese), 29(4): 37-46.
Deng X, Perkins-Kirkpatrick S E, Lewis S C, et al. 2021. Evaluation of extreme temperatures over Australia in the historical simulations of CMIP5 and CMIP6 models. Earth's Future, 9(7): e2020EF001902, doi:10.1029/2020EF001902.
Eyring V, Bony S, Meehl G A, et al. 2016. Overview of the coupled model intercomparison project Phase 6 (CMIP6) experimental design and organization. Geoscientific Model Development, 9(5): 1937-1958, doi:10.5194/gmd-9-1937-2016.
Guo Y, Dong W J, Ren F M, et al. 2013. Surface air temperature simulations over China with CMIP5 and CMIP3. Advances in Climate Change Research, 4(3): 145-152, doi:10.3724/SP.J.1248.2013.145.
Hamed M M, Nashwan M S, Shahid S, et al. 2022. Inconsistency in historical simulations and future projections of temperature and rainfall: A comparison of CMIP5 and CMIP6 models over Southeast Asia. Atmospheric Research, 265: 105927, doi:10.1016/j.atmosres.2021.105927.
He W, Bu C R, Xiong Z P, et al. 2013. Characteristics of temperature and precipitation in Northeastern China from 1961 to 2005. Acta Ecologica Sinica (in Chinese), 33(2): 519-531. doi: 10.5846/stxb201111241799
Hu Q, Jiang D B, Fan G Z. 2014. Evaluation of CMIP5 models over the Qinghai-Tibetan Plateau. Chinese Journal of Atmospheric Sciences (in Chinese), 38(5): 924-938.
Jiang D B, Hu D, Tian Z P, et al. 2020. Differences between CMIP6 and CMIP5 models in simulating climate over China and the East Asian Monsoon. Advances in Atmospheric Sciences, 37(10): 1102-1118, doi:10.1007/s00376-020-2034-y.
Jiang S, Jiang Z H, Li W, et al. 2017. Evaluation of the extreme temperature and its trend in China simulated by CMIP5 models. Climate Change Research (in Chinese), 13(1): 11-24, doi:10.12006/j.issn.1673-1719.2016.053.
O'Neill B C, Tebaldi C, Van Vuuren D P, et al. 2016. The scenario model intercomparison project (ScenarioMIP) for CMIP6. Geoscientific Model Development, 9(9): 3461-3482, doi:10.5194/gmd-9-3461-2016.
Papalexiou S M, Rajulapati C R, Clark M P, et al. 2020. Robustness of CMIP6 historical global mean temperature simulations: trends, long-term persistence, autocorrelation and distributional shape. Earth's Future, 8(10): e2020EF001667, doi:10.1029/2020EF001667.
Pierce D W, Barnett T P, Santer B D, et al. 2009. Selecting global climate models for regional climate change studies. Proceedings of the National Academy of Sciences of the United States of America, 106(21): 8441-8446, doi:10.1073/pnas.0900094106.
Ren G Y, Guo J, Xu M Z, et al. 2005. Climate changes of China's mainland over the past half century. Acta Meteorologica Sinica (in Chinese), 63(6): 942-956.
Schuenemann K C, Cassano J J. 2009. Changes in synoptic weather patterns and Greenland precipitation in the 20th and 21st centuries: 1. Evaluation of late 20th century simulations from IPCC models. Journal of Geophysical Research: Earth Surface, 114(D20): D20113, doi:10.1029/2009JD011705.
Su J Z, Wen M, Ding Y H, et al. 2016. Hiatus of global warming: A review. Chinese Journal of Atmospheric Sciences (in Chinese), 40(6): 1143-1153, doi:10.3878/j.issn.1006-9895.1512.15242.
Sun J Q, Ao J. 2013. Changes in precipitation and extreme precipitation in a warming environment in China. Chinese Science Bulletin, 58(12): 1395-1401. doi: 10.1007/s11434-012-5542-z
Tao C W, Jiang C, Sun J X. 2016. Evaluation of CMIP5 Models performance on climate simulation in Northeast China. Climatic and Environmental Research (in Chinese), 21(3): 357-366, doi:10.3878/j.issn.1006-9585.2015.15275.
Taylor K E. 2001. Summarizing multiple aspects of model performance in a single diagram. Journal of Geophysical Research: Atmospheres, 106(D7): 7183-7192, doi:10.1029/2000JD900719.
Wang T, Wang Y S, Shen Y M, et al. 2020. Assessment of air temperature simulation and threshold-crossing times of 2℃ warmings by CMIP5 models in Liaoning province. Journal of Meteorology and Environment (in Chinese), 36(2): 49-61.
Wei M, Qiao F L. 2016. Attribution analysis for the failure of CMIP5 climate models to simulate the recent global warming hiatus. Science China Earth Sciences, 60(2): 397-408.
Wu J, Gao X J. 2013. A gridded daily observation dataset over China region and comparison with the other datasets. Chinese Journal of Geophysics (in Chinese), 56(4): 1102-1111, doi:10.6038/cjg20130406.
Wu J H, Sheng Z L, Du J Q, et al. 2021. Spatiotemporal change patterns of temperature and precipitation in Northeast China from 1956 to 2017. Research of Soil and Water Conservation (in Chinese), 28(3): 340-347, doi:10.13869/j.cnki.rswc.2021.03.037.
Yang X L, Zhou B T, Xu Y, et al. 2021. CMIP6 evaluation and projection of temperature and precipitation over China. Advances in Atmospheric Sciences, 38(5): 817-830. doi: 10.1007/s00376-021-0351-4
You Q L, Cai Z Y, Wu F Y, et al. 2021. Temperature dataset of CMIP6 models over China: evaluation, trend and uncertainty. Climate Dynamics, 57(1): 17-35, doi:10.1007/S00382-021-05691-2.
Yun X, Cheng J Y, Li Q X. 2020. Estimation of CMIP5 multi-mode on the extent of rise in air temperature in Asia. Meteorological Monthly (in Chinese), 46(2): 145-157.
Zhang B, Dai X G. 2017. Evaluation and correction for the deviation of the surface air temperature based on 24 CMIP5 models over China for 2006-2015. Plateau Meteorology (in Chinese), 36(6): 1619-1629, doi:10.7522/j.issn.1000-0534.2016.00136.
Zhang L X, Chen X L, Xin X G. 2019. Short commentary on CMIP6 scenario model intercomparison project (ScenarioMIP). Climate Change Research (in Chinese), 15(5): 519-525.
Zhang Y W, Zhang L, Xu Y. 2016. Simulations and projections of the surface air temperature in China by CMIP5 models. Climate Change Research (in Chinese), 12(1): 10-19, doi:10.12006/j.issn.1673-1719.2015.113.
Zhao T B, Guo W D, Fu C B. 2008. Calibrating and evaluating reanalysis surface temperature error by topographic correction. Journal of Climate, 21(6): 1440-1446, doi:10.1175/2007JCLI1463.1.
Zhao Z C, Luo Y, Huang J B. 2013. A review on evaluation methods of climate modeling. Progressus inquisitiones de mutatione climatis (in Chinese), 9(1): 1-8, doi:10.3969/j.issn.1673-1719.2013.01.001.
Zhou M Z, Wang H J, Huo Z G. 2017. The influence of heat stress on maize yield and its association with atmospheric general circulation and sea surface temperature. Climatic and Environmental Research (in Chinese), 22(2): 134-148, doi:10.3878/j.issn.1006-9585.2016.16119.
Zhou T J, Zou L W, Chen X L. 2019. Commentary on the Coupled Model Intercomparison Project Phase 6 (CMIP6). Climate Change Research (in Chinese), 15(5): 445-456.
Zhou W C, Han Z Y. 2018. Assessing CMIP5 climate simulations and objective selection of models over the Yellow River basin. Journal of Meteorology and Environment (in Chinese), 34(6): 42-55.
敖雪, 赵春雨, 崔妍等. 2021. 中国东北地区气温变化的模拟评估与未来情景预估. 气象与环境学报, 37(1): 33=42, doi:10.3969/j.issn.1673-503X.2021.01.005.
崔妍, 李倩, 周晓宇等. 2013. 5个全球气候模式对中国东北地区地面温度的模拟与预估. 气象与环境学报, 29(4): 37-46. https://www.cnki.com.cn/Article/CJFDTOTAL-LNQX201304006.htm
贺伟, 布仁仓, 熊在平等. 2013. 1961-2005年东北地区气温和降水变化趋势. 生态学报, 33(2): 519-531. https://www.cnki.com.cn/Article/CJFDTOTAL-STXB201302025.htm
胡芩, 姜大膀, 范广洲. 2014. CMIP5全球气候模式对青藏高原地区气候模拟能力评估. 大气科学, 38(5): 924-938. https://www.cnki.com.cn/Article/CJFDTOTAL-DQXK201405009.htm
蒋帅, 江志红, 李伟等. 2017. CMIP5模式对中国极端气温及其变化趋势的模拟评估. 气候变化研究进展, 13(1): 11-24, doi:10.12006/j.issn.1673-1719.2016.053.
任国玉, 郭军, 徐铭志等. 2005. 近50年中国地面气候变化基本特征. 气象学报, 63(6): 942-956. https://www.cnki.com.cn/Article/CJFDTOTAL-QXXB200506010.htm
苏京志, 温敏, 丁一汇等. 2016. 全球变暖趋缓研究进展. 大气科学, 40(6): 1143-1153, doi:10.3878/j.issn.1006-9895.1512.15242.
陶纯苇, 姜超, 孙建新. 2016. CMIP5模式对中国东北气候模拟能力的评估. 气候与环境研究, 21(3): 357-366, doi:10.3878/j.issn.1006-9585.2015.15275.
王涛, 王乙舒, 沈玉敏等. 2020. CMIP5模式对辽宁省气温模拟能力及未来2℃升温阈值出现时间评估. 气象与环境学报, 36(2): 49-61. https://www.cnki.com.cn/Article/CJFDTOTAL-LNQX202002007.htm
魏萌, 乔方利. 2016. CMIP5气候模式模拟的1850~2014年全球温度变化的集合经验模态分解. 中国科学: 地球科学, 46(12): 1675-1688, doi:10.1360/N072015-00465.
吴佳, 高学杰. 2013. 一套格点化的中国区域逐日观测资料及与其它资料的对比. 地球物理学报, 56(4): 1102-1111, doi:10.6038/cjg20130406. http://www.geophy.cn/article/doi/10.6038/cjg20130406
吴金华, 盛芝露, 杜加强等. 2021. 1956-2017年东北地区气温和降水的时空变化特征. 水土保持研究, 28(3): 340-347, doi:10.13869/j.cnki.rswc.2021.03.037.
云翔, 程嘉艺, 李庆祥. 2020. CMIP5气候模式对亚洲升温幅度的模拟与预估. 气象, 46(2): 145-157. https://www.cnki.com.cn/Article/CJFDTOTAL-QXXX202002001.htm
张蓓, 戴新刚. 2017. 基于CMIP5的2006-2015年中国气温预估偏差分析及订正. 高原气象, 36(6): 1619-1629, doi:10.7522/j.issn.1000-0534.2016.00136.
张丽霞, 陈晓龙, 辛晓歌. 2019. CMIP6情景模式比较计划(ScenarioMIP)概况与评述. 气候变化研究进展, 15(5): 519-525. https://www.cnki.com.cn/Article/CJFDTOTAL-QHBH201905012.htm
张艳武, 张莉, 徐影. 2016. CMIP5模式对中国地区气温模拟能力评估与预估. 气候变化研究进展, 12(1): 10-19. https://www.cnki.com.cn/Article/CJFDTOTAL-QHBH201601002.htm
赵宗慈, 罗勇, 黄建斌. 2013. 对地球系统模式评估方法的回顾. 气候变化研究进展, 9(1): 1-8. https://www.cnki.com.cn/Article/CJFDTOTAL-QHBH201301002.htm
周梦子, 王会军, 霍治国. 2017. 极端高温天气对玉米产量的影响及其与大气环流和海温的关系. 气候与环境研究, 22(2): 134-148, doi:10.3878/j.issn.1006-9585.2016.16119.
周天军, 邹立维, 陈晓龙. 2019. 第六次国际耦合模式比较计划(CMIP6)评述. 气候变化研究进展, 15(5): 445-456. https://www.cnki.com.cn/Article/CJFDTOTAL-QHBH201905001.htm
周文翀, 韩振宇. 2018. CMIP5全球气候模式对中国黄河流域气候模拟能力的评估. 气象与环境学报, 34(6): 42-55. https://www.cnki.com.cn/Article/CJFDTOTAL-LNQX201806005.htm
-
图(6)
表(3)
计量
- 文章访问数: 3629
- PDF下载数: 170
- 施引文献: 0